This economic base assessment provides information on which industries and occupations are most prominent in the area, and their relative strength or weakness.
Two separate analyses were conducted to assess the regional and each county’s economic base: a Location Quotient analysis and a Shift-Share analysis. The analyses used 2004 and 2023 employment data, and were completed using two reference areas, the State of Ohio and the U.S. All source data provided courtesy of Dayton Development Coalition, using Lightcast™ 2024.3, dataset retrieved September 3, 2024.
Location Quotient Analysis
The Location Quotient (LQ) Analysis measures the relative concentration of each industry sector or occupational group in an area’s economy compared to a larger reference area. It identifies sectors that are “Basic” and “Non-Basic” in the Region.
A “Basic” sector is an industry sector or occupational group that produces and distributes goods and services for export outside the Region, while a “Non-Basic” sector is an industry sector or occupational group whose goods and services are mainly consumed within the Region.
The LQ is the ratio of an industry’s share of the local economy divided by its share in a larger economy.
- LQ Greater than 1 — The employment in that industry sector or occupational group is more concentrated than the reference area, and that industry sector or occupational group is likely to be a “Basic” sector, exporting its products or services outside the Region
- LQ Less than or Equal to 1 — The employment in that industry sector or occupational group is less concentrated than the reference area, and that industry sector or occupational group is likely to be a “Non-Basic” sector, serving only Regional demand. The products or services in this industry sector or occupational group may have to be imported into the regional economy to meet demand.
Shift Share Analysis
The Shift-Share Analysis measures the relative changes that have taken place over time and reveals how strong or weak each industry sector or occupational group is in the Region. Regional economic growth or decline can be due to different factors. The Shift-Share Analysis separates Regional growth/decline during a time period into three components: Reference Area Growth, Industry Mix, and Regional Shift components. Therefore, the Total Employment Change = Reference Area Growth Effect + Industry Mix Effect + Regional Shift Effect.
- Reference Area (State/U.S.) Growth: The growth or decline in regional employment that could be attributed to the overall growth/decline of the reference area.
- Industry Mix: The additional gain (or loss) in regional employment that could be attributed to the specific industry sector or occupational group growing faster (or slower) than the rate of all industries or occupations combined in the reference area.
- Regional Shift: The additional gain (or loss) in regional employment for a specific industry sector or occupational group beyond the Reference Area Growth and Industry Mix effects resulting from the industry or occupation growing faster (or slower) in the Region.
How to read the economic base assessment chart
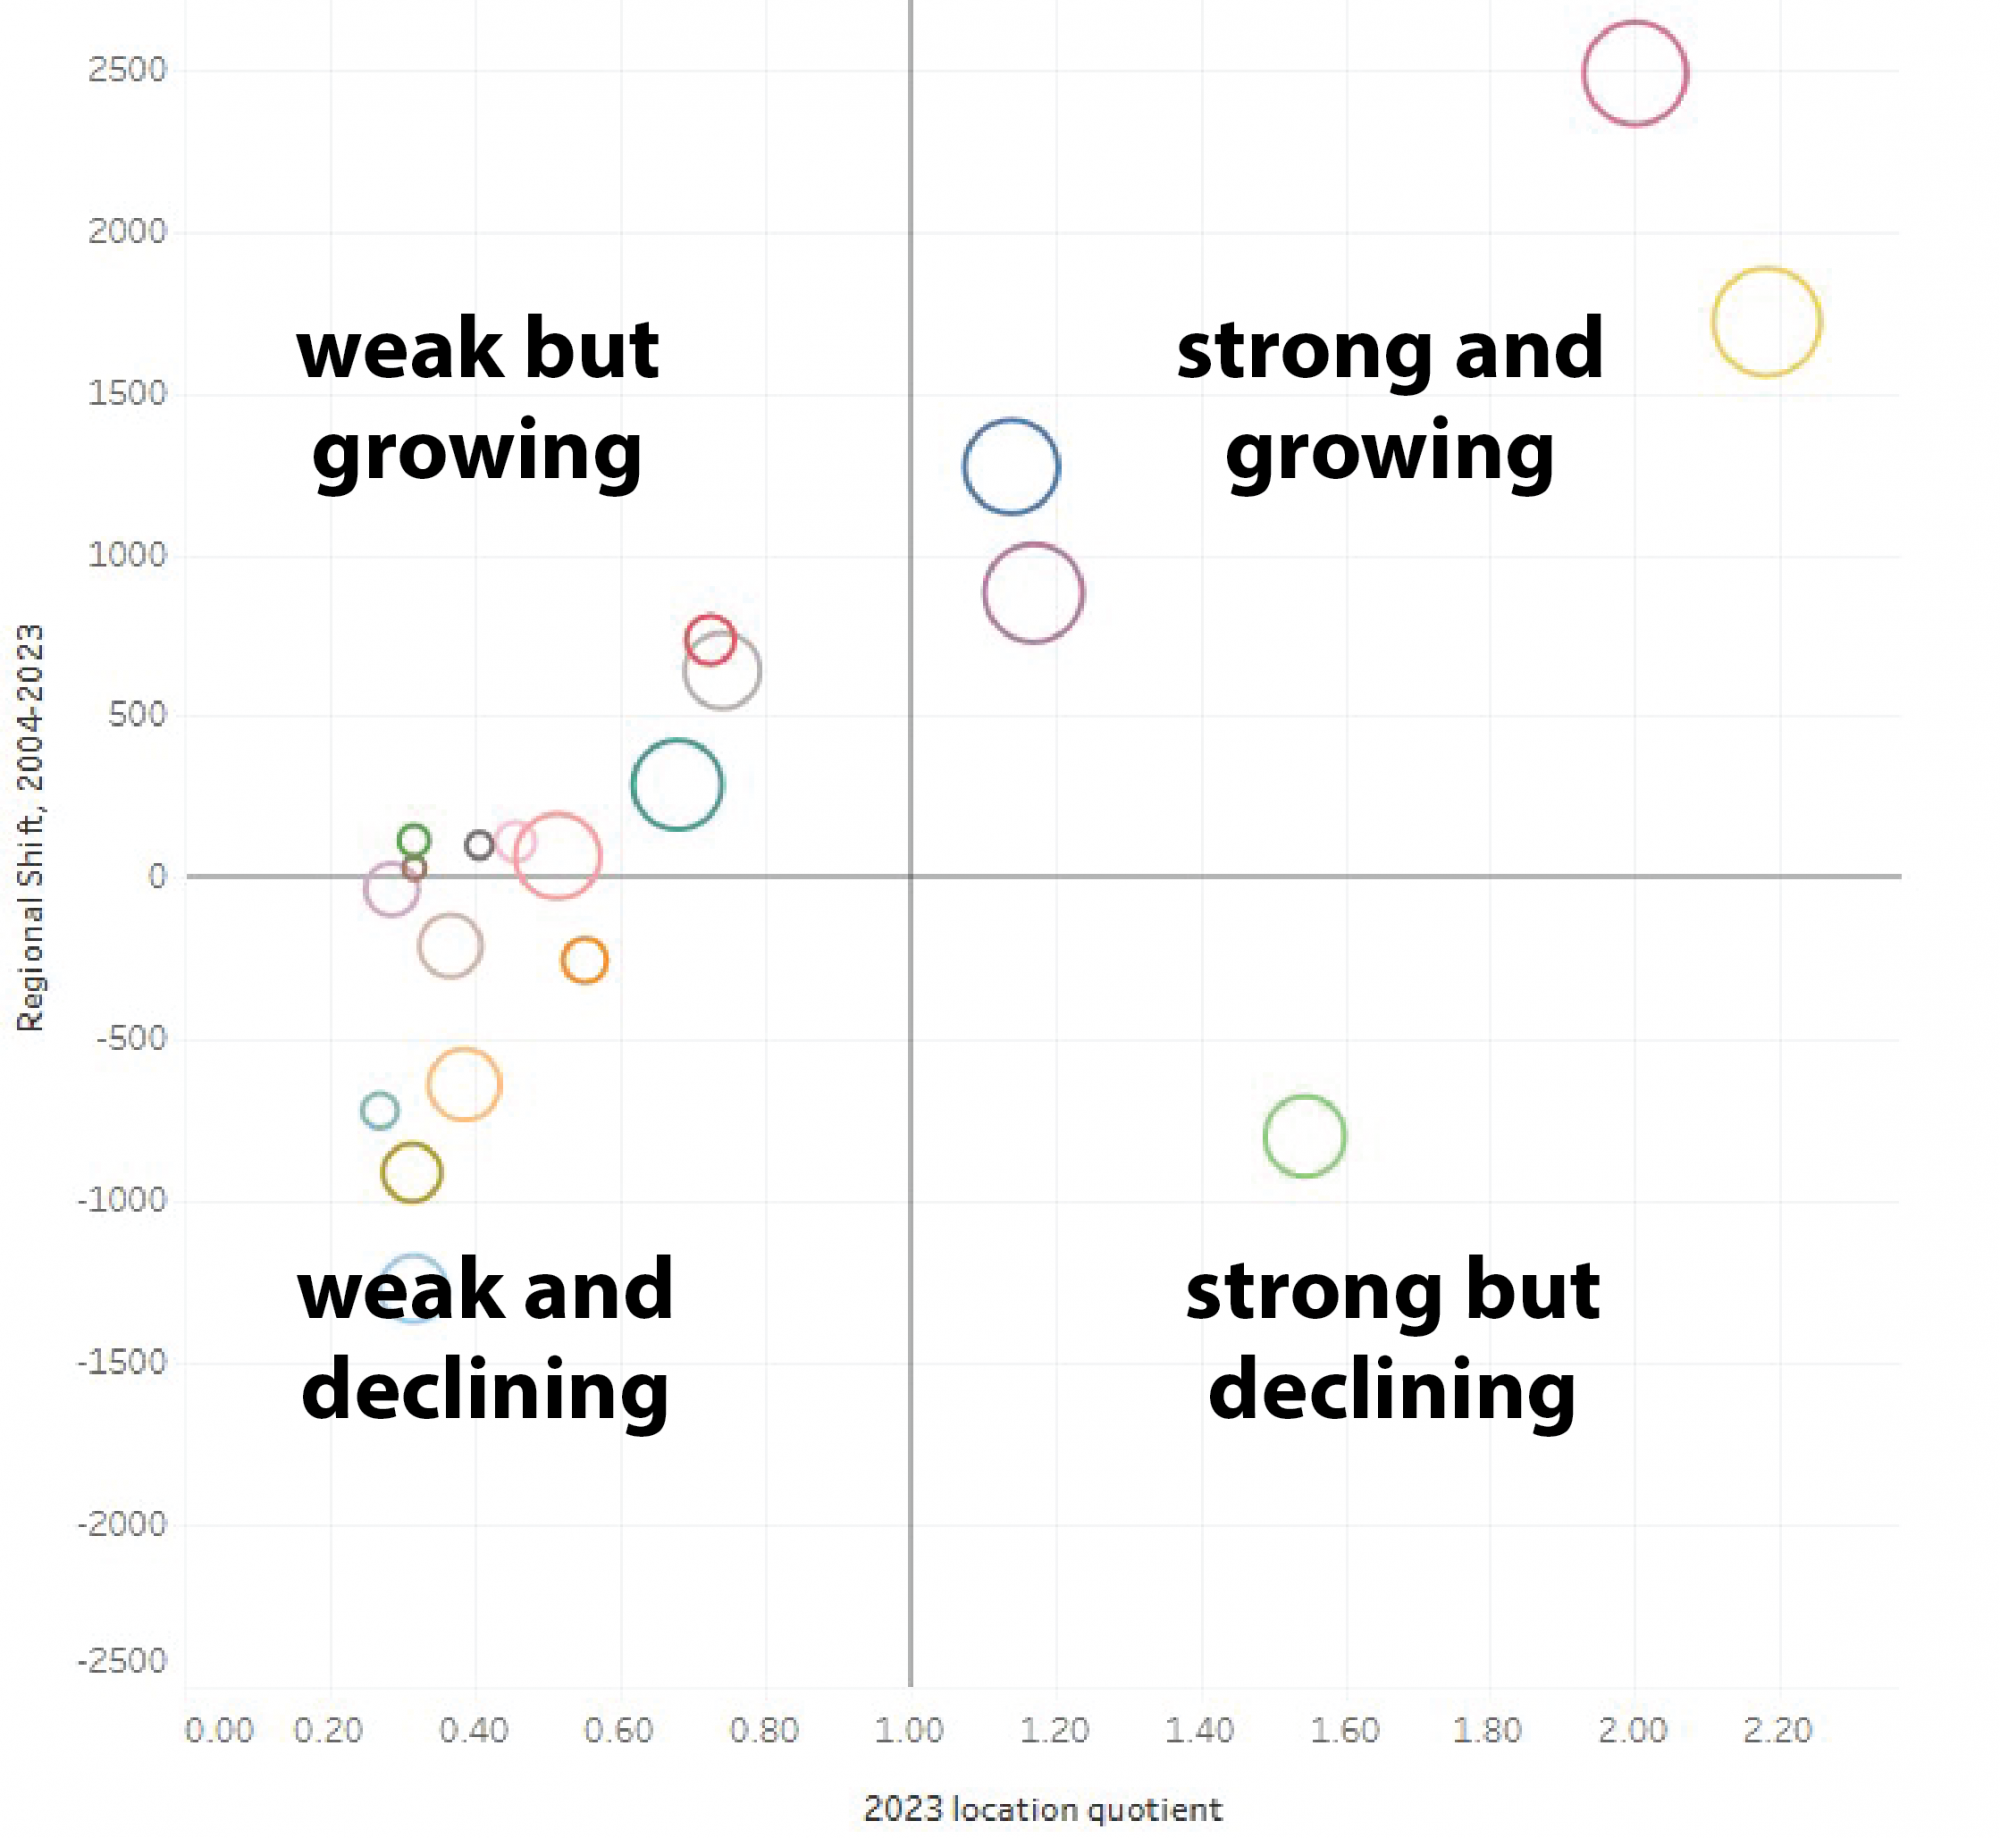
The chart below provides an example of the economic base assessment. The size of the bubble reflects the total employment in 2023, the horizontal axis represents the location quotient, and the vertical axis represents the regional shift of the industry or occupational group between 2004 and 2023.
This makes four quadrants into which each industry or occupational group will fall: strong and growing, for groups that are more concentrated in the focus geography and have grown; strong but declining, for groups that are concentrated but have not grown; weak and declining, for groups that are less concentrated and have not grown; and weak but growing, for groups that are less concentrated, but have grown.
Learn more about the methodology (pdf) for this economic base assessment.


